“Video advertising is still ‘in its diapers’… you gotta remember that most people don’t want to see ads” said eMarketer’s David Hallerman in a webcast last Thursday (October 21, 2010). eMarketer provided highlights from a report (“Video Advertisement Engagement: What Marketers Need to Know”) in the one-hour webinar, and slides are excerpted from that.
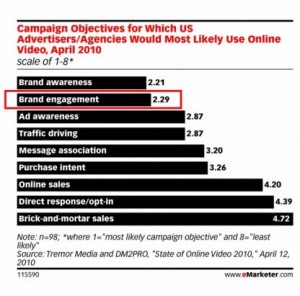
Hallerman says online-video is the most expensive form of digital advertising, and skews toward professional content not user-generated. He explores both the definitions and forms of engagement. Per the chart on the right, awareness is still the #1 goal of marketers followed closely by engagement (according to an April 2010 study by Tremor Media of 98 advertisers/agencies).
So what is engagement? Some say it’s paying attention, others refer to interactivity, and still others refer to what happens afterwards.
I’d prefer to focus on what Hallerman calls server based data (a view, start-rate, completion time, mouse-over, sharing) and not survey data (like “brand health” metrics like awareness or intent, reported by Insight Express or Dynamic Logic). However those “brand health” metrics can be vital to determining “intent to buy,” which is often not captured by server metrics (although some cookies provide advertisers data about purchases that occur long after a video view).
Engagement metrics include:
- Interactivity (clicking ad or mousing over): Scanscout’s cost-per-engagement. Hallermans says there’s an increasing desire among marketers for interactive pre-rolls.
- Sharing or commenting
- Interactions, experience (Forbes)
- Two-way
Context is also important… an auto-roll on gaming or entertainment site is not going to be as powerful as a self-directed and completed video on a shopping site. Hallerman reminds us that consumers value HD (above many other factors) and that quality (original versus repurposed) is vital, and that’s an important insight. During the Q&A Hallerman later acknowledged that some studies are showing that repurposed television commercials are faring better than once expected.
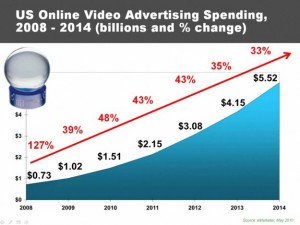
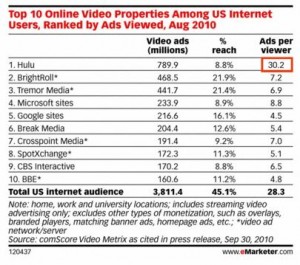
eMarketer projects continued growth of the medium as depicted above — reaching at least $5.5 billion by 2014. But when it comes to online-video ad views, all video sites aren’t created equally (comScore, Sept. 30, 2010). The report shows that “ads per viewer” on Hulu is more than seven times higher than Google/YouTube sites. See the rank of video-advertising properties, and Hulu tops followed by Brightcove and Tremor Media (both which serve ads on websites not exclusively devoted to video content). At 30 ads per viewer per month, it’s no wonder Hulu is considering cutting its monthly subscription in half.
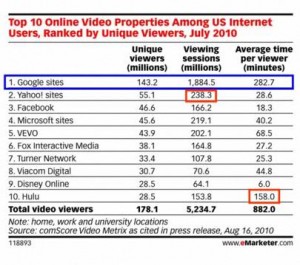
Time per month per viewer on YouTube is nearly twice that of Hulu, despite Hulu’s content being generally longer (22 minute shows versus 2-3 minute videos). Hallerman refers to Hulu’s experience as “lean back” because we allow the show “to wash over” us, whereas other sites (YouTube) require a more “lean forward” experience. Marketers, says Hallerman, are looking for what they know from broadcast advertising — pre or mid-rolls played “in stream” during a video’s view.
Marketers choose ad-networks to target online-video ads based on two factors: demographic or content. A beauty ad on Break.com, Hallerman explains, won’t likely get high engagement. As for viral?
“…You don’t just make something go viral,” Hallermans says. “It’s really a whole process that needs a blend of paid, owned and earned.” He provides the recent Old Spice example, which involved paid ads on television and the web, a microsite showing more content, and “earned” media where video answers responded to specific bloggers. He credits the paid ads were the “spark.”
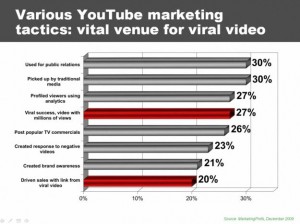
Aside from viral or its own reason, here are what some marketers claim to have accomplished on YouTube. So one in five (20%) say their YouTube videos have driven sales via links. But recognize that the data are not saying that happens twenty percent of the time- it’s usually in the low single digits in my experience.
Branded content (where the marketing is not “heavy handed” and is “almost a bi-product”) is the most effective forms of marketing according to an October 2010 report by the CMO Council. Branded content tops more traditional online advertising models or even database-driven behavioral marketing. Video content, for instance, about dogs with dog-food product placement… may have a greater impact than dog-food ads alone. “Creating an experience,” Hallerman says, “is hard but important.” These can be tracked by brand-equity scores. He provides another example of a hair-care product that might show entertaining or educational fashion tips (focusing on benefits) rather than advertising about the product (features).
During the eMarketer webcast, EyeWonder shared “server side” data that show higher engagement rates for ads in the financial sector, with travel or electronics on the low side of engagements. EyeWonder showed a case study involving Gatorade’s G Series, which featured a 15-second ad that allows customers to see how the beverage helps before, during and after an athletic event. The click-thru rate was a tame .13%, but the a video completion rate was an impressive 62% across all of the impressions.
Hallerman was asked to comment on how to make a video more likely to be viral, but said if he had the answer he’d be working at an agency. Perhaps he just needs a copy of “Beyond Viral.” 🙂

This post was wonderfully soporific. I’m bookmarking this for the next time I’m seeking something hypnagogic.
Way too many words for me. Sorry, didn’t read this post.
Do I get college credits for reading these long posts?
I read the whole thing AND slept at the same time.
It’s multitasking.
I didn’t read any of the text, but I tried to read the graphs. Get with the times, Nalts – if you’re going to use screen shots, make sure they are legible and the highest quality possible. The last one is especially useless.